How to Measure Team Productivity That Matters
Measuring team productivity isn't about counting the hours people put in. It's about understanding the actual impact of their work. The best way to do this is to shift your focus from activity to outcomes.
Think about it: you need a blend of hard numbers, like tasks completed, and softer feedback, like the quality of the work, to get the full picture. This approach helps you see the real value your team is creating, not just how busy they look.
Moving Beyond Busywork to Measure Real Impact
So many teams are still judged by old-school standards that just don't fit how we work today. Tracking hours logged or the number of emails sent might make it seem like everyone is productive, but it often just rewards busywork instead of work that truly matters. This can leave your team feeling completely drained and frustrated, spinning their wheels without making progress on important goals.
Imagine a marketing team that blasts out ten email campaigns a week. That sounds impressive, right? But if none of those campaigns bring in any leads or sales, how productive was the team, really? This is a classic case of confusing effort with impact. True productivity is about getting the right things done, and doing them well.
From Input-Focused to Outcome-Driven
To get a real handle on team productivity, you have to look at what your team achieves (outcomes) rather than just what they do (inputs). This means valuing the quality and impact of their work over the sheer volume of it.
A massive, often invisible, productivity killer is something called "work about work." This is all the stuff that isn't the actual job—hunting down information, constantly switching between apps, or sitting in meetings that could have been an email. Research shows that people can spend a staggering 60% of their time on these kinds of tasks. This administrative clutter buries real progress and makes it nearly impossible to see where the value is.
Key Takeaway: Measuring productivity isn't about watching over your team's shoulder or tracking every single minute. It's about giving them clarity and focus, so they can pour their energy into work that produces real results and moves the business forward.
To help your team focus on high-impact work, you first need to simplify their processes. A fantastic place to start is by getting rid of repetitive, manual tasks. Our guide on how to automate repetitive tasks offers some great, practical strategies for this. When you clear away the busywork, you can finally start measuring what actually matters.
The table below breaks down this fundamental shift in thinking. It contrasts the old way of measuring productivity with a more modern, effective approach.
Traditional vs. Modern Productivity Metrics
| Metric Type | Traditional Approach (Input-Focused) | Modern Approach (Outcome-Focused) |
|---|---|---|
| Effort | Hours Logged / Time at Desk | Time to Complete Key Projects |
| Volume | Number of Emails Sent / Calls Made | Customer Satisfaction Scores (CSAT) |
| Activity | Tasks Completed (Regardless of Value) | Goals Achieved / KPIs Met |
| Output | Lines of Code Written | Feature Adoption Rate / Bug-to-Feature Ratio |
| Pace | Meetings Attended / Reports Filed | Project Cycle Time / Lead-to-Sale Conversion Rate |
As you can see, the modern approach ties every metric back to a meaningful business result. It's not about how hard someone appears to be working; it's about the tangible value they deliver. This shift helps everyone on the team understand what success looks like and how their individual contributions fit into the bigger picture.
Choosing Productivity Metrics That Actually Fit Your Team

There’s no magic yardstick for team productivity. What works for a sales team—like deals closed or calls made—is completely useless for a group of software developers. The trick is to pick metrics that genuinely reflect what your team is trying to achieve.
Before you even think about tracking, sit down and have a real conversation with your team. A great starting point is asking, "What does a really productive week actually look like for us?" You’ll be surprised at the insights you get. This one step helps define success in a way that makes sense to the people on the ground and gets them on board from day one.
Go Beyond the Numbers: Mix Quantitative and Qualitative
Productivity isn't just about raw numbers; it's about the quality and impact of the work. If you only track one or the other, you're flying with one eye closed. A good system always blends the hard data (quantitative) with the story behind it (qualitative).
For example, a marketing team could churn out 10 blog posts in a week. That’s a great number. But if those posts don't rank on Google, attract readers, or generate a single lead, was the team truly productive? The qualitative side—content quality, audience engagement, SEO impact—tells the rest of the story.
Here's how this balance plays out for different teams:
- Software Development Team:
- The Numbers (Quantitative): Cycle time (how fast an idea becomes a feature), number of bugs squashed.
- The Story (Qualitative): Feedback from peer code reviews, how many users actually adopt the new feature, the complexity of problems solved.
- Customer Support Team:
- The Numbers (Quantitative): Number of tickets resolved, average first response time.
- The Story (Qualitative): Customer satisfaction (CSAT) scores, positive mentions in feedback, the quality and thoroughness of the solutions provided.
A classic trap is focusing only on what's easy to count. When you do that, you can accidentally encourage the wrong behavior. Pushing a support team to close more tickets might just lead to rushed, sloppy answers and a wave of unhappy customers.
Tailor Metrics to Specific Team Roles
Once you’ve got a balanced view, it's time to get specific. The metrics for each team should be tailored to what they actually do. The goal isn't to measure everyone against some generic corporate standard but to track progress toward their unique objectives.
For a sales team, it's pretty direct: leads generated, conversion rates, and revenue booked tell you almost everything you need to know.
But for a creative team? It’s far more nuanced. Instead of counting designs, you might track things like project milestones met or positive client feedback scores. If you're looking for an easy way to visualize this kind of custom data, you can build a KPI widget with Widgetly that puts your team’s most important numbers front and center.
This role-specific approach makes sure everyone is being measured by what matters for their job. It completely reframes the conversation from "Are you busy?" to "Are you making a real impact?" That clarity is empowering, and it turns productivity tracking into a tool for growth, not just a method of oversight.
Putting Your Measurement System Into Action
You've picked your metrics—now it's time to build a system that actually works. The real key here is how you introduce it. If your team sees this as a micromanagement tool, you've lost before you've even started. A rushed rollout almost always backfires, creating suspicion and pushback.
My advice? Take it slow. Start with a single, clear objective. What's the one thing you’re trying to improve right now? Maybe you want to shorten project cycle times or bump up customer satisfaction scores. Whatever it is, focusing on one primary goal keeps the whole team aligned and prevents overwhelm.
Establishing a Performance Baseline
Before you can spot improvements, you need to know where you're starting from. This is your performance baseline—a clear snapshot of your team's current state. Without it, you’re just swimming in numbers with no context.
For the first few weeks, just let the data roll in. Don't change a thing about your workflows. Just quietly gather information on the metrics you chose.
This initial phase does two crucial things:
- It gives you a realistic benchmark. You’ll quickly see what an average week looks like, complete with its natural highs and lows.
- It lets you sanity-check your metrics. You might realize one of your chosen metrics isn't telling you what you thought it would. Now's the time to tweak it.
This baseline becomes your anchor. It’s what you'll measure against to celebrate wins and pinpoint where a little extra support is needed. It turns vague goals into something everyone can see and work towards.
Communicating the Why Behind the What
How you talk about this with your team is everything. Frame the entire conversation around shared goals and making work better for everyone. Explain that you're not trying to watch over their shoulder, but to find and remove roadblocks, streamline processes, and help the team make a bigger impact.
Transparency is your best friend here. Be completely open about what you're measuring, why those specific metrics were chosen, and exactly how the data will be used. When people understand the "why," they're much more likely to see this as a supportive tool instead of a threat.
This isn't just about plugging in software. It's about fostering a culture where data informs conversations and helps everyone do their best work. If you're looking for tools that support this kind of open approach, our time tracking software comparison is a good place to start.
Integrating Measurement Into Daily Workflows
For this to stick, it can't feel like another tedious task on the to-do list. The only way it becomes sustainable is by weaving it directly into the tools your team already uses every day. If you're running on a platform like Widgetly, for example, you can set up dashboards that pull the data automatically. No manual entry, no extra hassle.
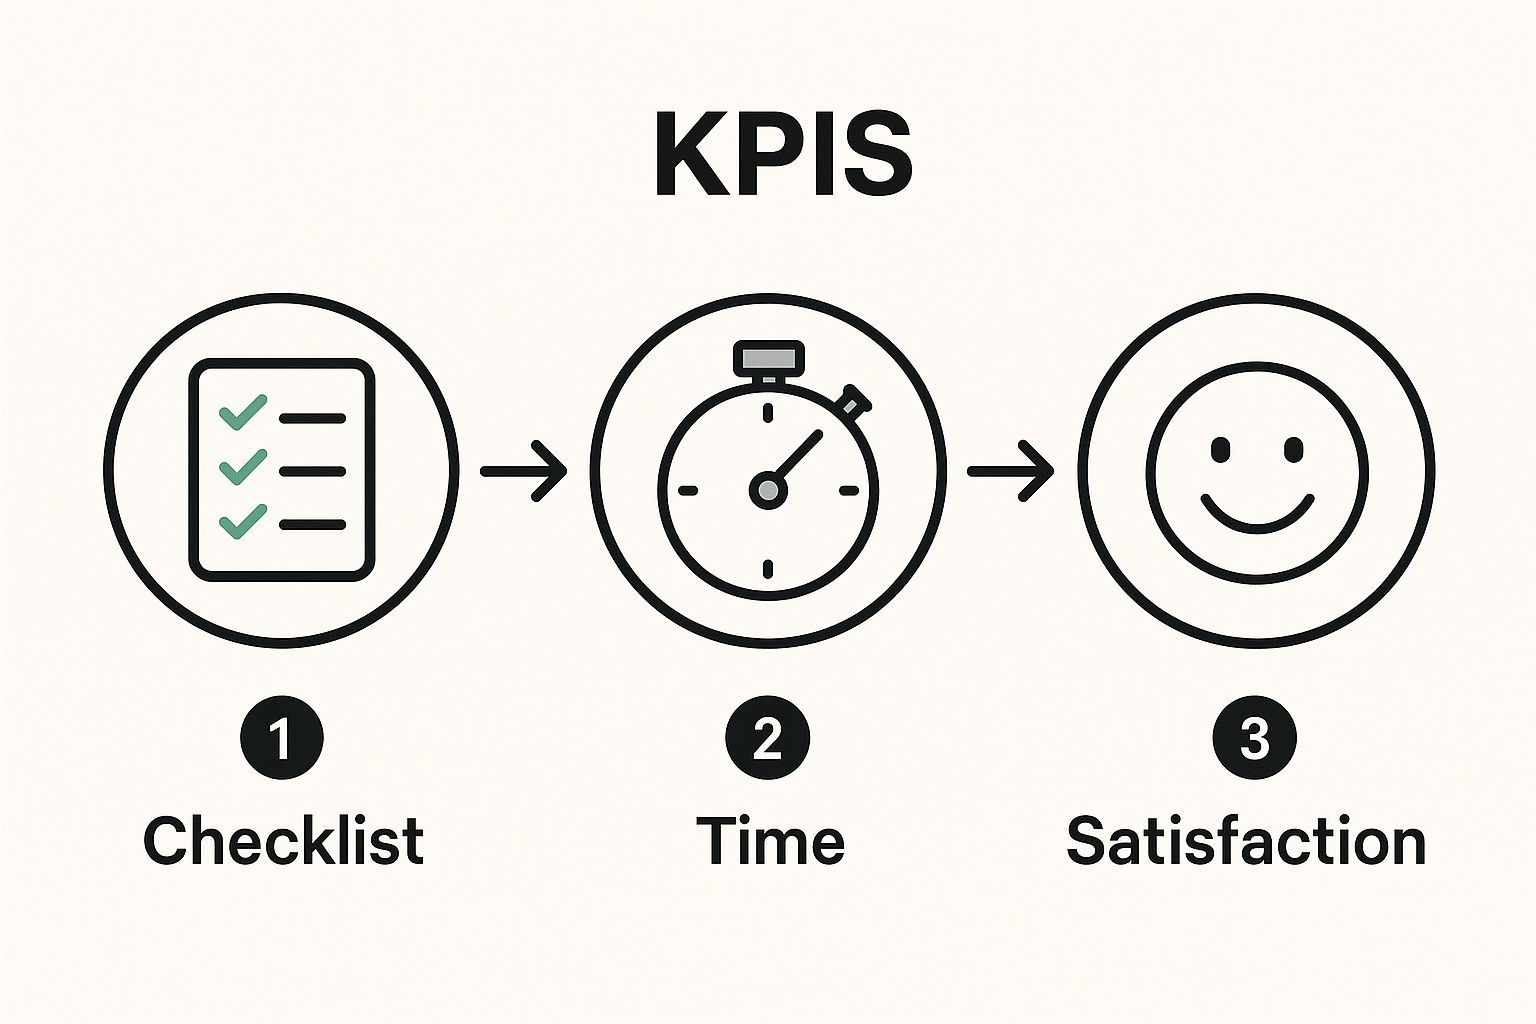
This image nails the three pillars of true productivity: getting things done (the checklist), managing time well (the stopwatch), and delivering quality work that people love (the smiley face). It's a great reminder that you need a balanced view to get the full story.
It also helps to keep the bigger picture in mind. Broader economic trends can give your team's performance valuable context. For instance, recent OECD data shows that labor productivity growth has slowed to just +0.4%, a big dip from the +1.8% average we saw before the pandemic. Looking at this kind of data reminds us that team performance doesn't happen in a vacuum.
Using Productivity Data to Drive Improvements
So, you’ve started collecting data. That's a great start, but it's just that—a start. Raw numbers are like puzzle pieces scattered on a table. They don’t mean much until you start piecing them together to see the whole picture of your team's performance.
When you dig into your productivity data, you're not playing the blame game. You're a detective looking for patterns. Is there a certain day of the week when everything seems to grind to a halt? Does one type of project always blow past its deadline? These trends are your clues, pointing you toward hidden bottlenecks and broken processes.
Spotting Trends and Uncovering Root Causes
Think of your data dashboard as a diagnostic tool for your team’s health. A sudden drop in output doesn't automatically mean your team is slacking. More often than not, it’s a symptom of a deeper issue, like a finicky software integration or a confusing project brief that’s causing more questions than answers.
I once saw a marketing team panic when their lead generation numbers dropped by 15% for the month. On the surface, it looked like a classic performance dip. But a closer look at the data showed the website’s main landing page was loading at a snail's pace, causing frustrated visitors to bail. The problem wasn't a lack of effort; it was a technical glitch nobody had noticed.
This is where a good analytics tool like Widgetly really shines. Having a clear visual of your project timelines and task completions makes it easy to spot these things before they become major problems.
When you can see where projects are on track and where they’re falling behind at a glance, you can react much faster.
Turning Data Into Constructive Conversations
Let's be clear: the goal here is to improve, not to micromanage. When you approach data with genuine curiosity, it becomes the starting point for supportive, problem-solving conversations—not another stressful performance review.
Key Insight: Use data to ask better questions, not to make accusations. Instead of asking, "Why are your numbers down?" try, "I noticed our cycle time is a bit longer this week. Is there anything getting in your way?"
This simple shift in framing changes everything. It turns you and your team into collaborative partners, working together to figure things out.
Here are a few practical ways to use data constructively:
- Celebrate Wins: Did a project get done ahead of schedule? Awesome. Dig into the data to see why. Was it a new workflow? A particularly great collaboration? Find out what worked and do more of it.
- Identify Support Needs: If someone’s output slows, it could be a sign that they need more training or are on the verge of burnout. The data can be your early warning system, letting you offer support before they even have to ask.
- Refine Your Processes: Do you see consistent delays in the same phase of every project? That’s not a people problem; it’s a process problem. Use that data to map out the workflow with your team and pinpoint exactly where things are getting stuck.
It can also be helpful to zoom out. For a little perspective, data from the International Labour Organization shows that workers in Luxembourg contribute an average of $166.1 to the GDP per hour, making it the world’s most productive country by that metric. While your team’s KPIs are obviously more specific, looking at high-level benchmarks like these can spark new ideas about efficiency. You can find more global productivity trends on Clockify.me if you're curious.
At the end of the day, data gives you a shared, objective language to talk about performance. It removes the guesswork and turns measurement into a powerful tool for your team’s continuous growth.
Common Mistakes to Avoid When Measuring Productivity
Getting a handle on your team's productivity is a smart move, but it's a path filled with potential pitfalls. I've seen well-intentioned leaders accidentally create more problems than they solve by making a few common mistakes.
Let's walk through what not to do.
https://www.youtube.com/embed/Ue0AsALspqs
Putting Individual Stats on a Pedestal
One of the quickest ways to derail team morale is to focus too much on individual metrics over shared goals. When you put all the emphasis on personal output, you're not-so-subtly encouraging a "me first" attitude.
Suddenly, people are less willing to help a coworker who's swamped, because it might ding their own numbers. This kind of thinking is toxic for a collaborative environment. Real breakthroughs happen when a team pulls together, not when everyone is just trying to win their own little race.
Wielding Data Like a Weapon
This one is a huge red flag. If your team sees productivity data as something that will be used against them in a performance review, you've already lost. They'll find clever ways to hit their targets, even if it means cutting corners or ignoring more important work.
When you see someone's numbers dip, your first question shouldn't be, "Why aren't you working hard enough?" It should be, "What's getting in your way?" This turns data into a tool for support, not a stick to beat people with.
The whole point is to support your team, not to surveil them. The data should be a starting point for a conversation, helping you uncover roadblocks and figure out how you can help them succeed.
Think about it this way: when employees get regular, constructive feedback, they're 3.6 times more likely to be motivated to do outstanding work. Using data to have supportive conversations is exactly how you make that happen.
Forgetting About the Unquantifiable Stuff
Some of the most valuable work your team does will never show up neatly on a dashboard. It's a massive mistake to ignore the contributions that are harder to measure but absolutely essential for a healthy, high-performing team.
What kind of work am I talking about?
- Mentoring a new teammate: This is a time investment that pays off enormously in the long run but can temporarily slow down a senior employee's "measurable" output.
- Creative brainstorming: That brilliant idea that solves a huge customer problem doesn't come from a predictable, trackable process.
- Building great client relationships: The rapport and trust that lead to contract renewals and referrals can't be boiled down to a simple KPI.
If you only celebrate what you can count, you're sending a clear message that these other critical activities don't matter. A truly accurate picture of productivity has to look beyond the numbers and recognize the full spectrum of value your team brings to the table.
Common Questions About Team Productivity
Even with the best plan in place, questions always pop up when you start measuring how your team is doing. Let’s walk through some of the most common hurdles managers and team leads face.
How Do You Measure Productivity for Creative Roles?
This is the classic dilemma, isn't it? For roles like designers, writers, or marketers, simply counting outputs—like the number of graphics churned out—completely misses the mark. A single brilliant campaign idea is worth a hundred mediocre ones. So, where do you even start?
The trick is to stop thinking about volume and start focusing on value. Instead of tallying up completed tasks, you want to measure progress against bigger goals and the actual impact of the work.
Here’s a more practical way to look at it:
- Project Milestones Are Your Friend: Track the completion of key project phases. For example, did the design team get the initial wireframes over on time? Did the final creative assets nail the requirements in the project brief?
- Connect Work to Business Impact: Tie creative efforts back to real business goals. For that new ad campaign, you could measure engagement rates or click-throughs rather than just counting how many ad variations were designed.
- Lean on Qualitative Feedback: Don't forget to ask people what they think. Regularly gathering feedback from stakeholders and clients can be incredibly revealing. A simple satisfaction score or a quick review can tell you more about quality than any spreadsheet.
How Often Should I Review Metrics With My Team?
Finding the right cadence for reviewing metrics is a balancing act. Do it too often, and you risk making everyone feel like they're under a microscope. Wait too long, and you miss the chance to course-correct.
A great rule of thumb is to weave data into your regular team check-ins instead of making it a separate, high-pressure event. This makes talking about metrics feel normal and helpful, not like a final exam.
A weekly or bi-weekly rhythm usually works well. Quick, informal check-ins during a team huddle are perfect for glancing at short-term trends. Save the deeper analysis for monthly meetings where you can talk about progress toward bigger goals and plan for the weeks ahead.
How Do I Handle Underperformance Identified Through Data?
This is where true leadership comes into play. When the data points to a potential performance issue, it’s a signal to offer support, not to assign blame. The numbers are just the beginning of a conversation.
First things first, approach the situation with curiosity. You can start the discussion by sharing what you’ve noticed in a neutral, non-judgmental way. For instance, instead of saying, "Your ticket resolution times are slipping," you could try something like, "I noticed our team's average resolution time has ticked up a bit. I wanted to check in and see if you're hitting any new roadblocks."
This opens the door for your team member to share what’s really going on. Maybe they’re struggling with a new piece of software, got hit with a string of unusually tough customer problems, or are just feeling swamped. Once you understand the root cause, you can figure out a solution together—whether that means more training, a change in process, or just shifting some things off their plate.