What Is a Business Intelligence Dashboard? Key Insights
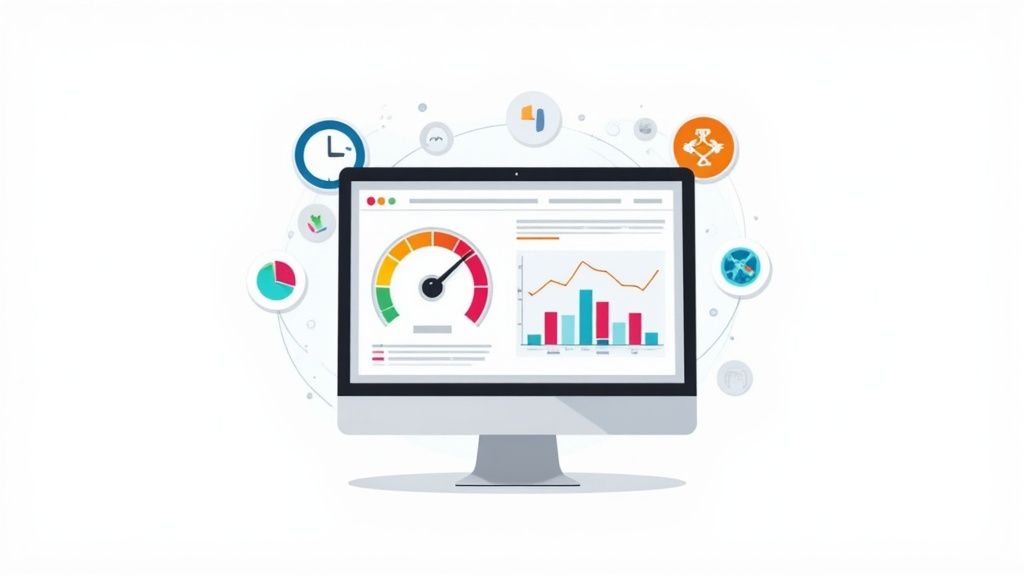
Think of a BI dashboard as your company's command center. It's a powerful data visualization tool that pulls all your critical information into one place, displaying it in a way that’s easy to grasp. Instead of wading through dense spreadsheets, you get a live, at-a-glance view of what's happening across sales, marketing, finance, and operations.
This immediate clarity helps you make smarter decisions, faster.
Decoding the Business Intelligence Dashboard
Trying to run a business without a BI dashboard is like trying to fly a plane without a cockpit. You’d be completely in the dark, with no way to check your speed, altitude, or fuel. A business intelligence dashboard is that essential cockpit, giving you all the instruments you need to navigate safely and effectively. It stops you from flying blind.
It brings together mountains of data from different systems into a single, intuitive screen. Suddenly, abstract numbers start telling a clear story, letting you see exactly how your business is performing right now.
The Core Purpose of a BI Dashboard
At its core, a BI dashboard is built to make data understandable for everyone, not just the data scientists. It turns complex information into visual stories using charts and graphs that highlight key trends, patterns, and anomalies. This gives people at every level the power to track performance, pinpoint problems, and seize opportunities without needing a technical background.
The end goal is to build a culture where decisions are guided by solid evidence, not just gut feelings. Its main jobs are to:
- Centralize Data: Pulls information from different tools like your CRM, ERP systems, and analytics platforms into a single hub.
- Visualize KPIs: Tracks your most important key performance indicators (KPIs) with interactive charts, graphs, and maps.
- Enable Self-Service Analytics: Lets users dig into the data themselves, applying filters and drilling down to find their own answers.
A great dashboard does more than just show you numbers—it gives you context. By comparing today's performance to past results or specific targets, it tells you not only what's happening but whether that's good or bad.
A Quick Look at BI Dashboard Fundamentals
This table breaks down the essential concepts of a BI dashboard, giving you a quick reference for its core purpose and value.
| Concept | Simple Explanation | Why It's Important |
|---|---|---|
| Data Visualization | Turning numbers into visual formats like charts, graphs, and maps. | Makes complex data easy to understand quickly and spot trends or issues. |
| Centralized View | Combining data from many different sources (e.g., sales, marketing) onto one screen. | Eliminates the need to jump between multiple reports, saving time and effort. |
| Real-Time Data | Displaying the most current information available, updated automatically. | Allows for proactive decision-making based on what's happening right now. |
| Interactive Elements | Features like filters and drill-downs that let users explore the data themselves. | Empowers non-technical users to find answers to their own specific questions. |
In short, these fundamentals work together to turn raw data into a clear, interactive, and always-current picture of your business.
From Raw Data to Actionable Insight
The real magic of a BI dashboard is its ability to turn messy, raw data into clean, useful insights. Think of it like a chef who takes a pile of raw ingredients (data points from sales logs, website traffic, and financial records) and turns them into a beautifully prepared meal (a visual summary of your business's health).
This process ensures the information you're seeing is not only accurate but directly tied to your company’s goals. In fact, businesses that use BI dashboards effectively are five times more likely to make fast, well-informed decisions. By making complex information simple, these tools give every leader the clarity they need to steer the company in the right direction.
How a BI Dashboard Actually Works
So, what's really going on behind that clean, intuitive screen of charts? While you see a polished final product, a powerful process is working under the hood to turn messy, raw data into clear, actionable insights. Think of it like a sophisticated data assembly line.
This journey happens in a few key stages, transforming what looks like a jumble of numbers into a coherent story that can guide your business decisions. It all starts with gathering the raw materials from wherever they live.
The entire workflow, from chaotic data to clear visuals, really boils down to three core steps.
This graphic gives you a simplified look at the whole process, from collecting the data to analyzing it and finally, visualizing it.
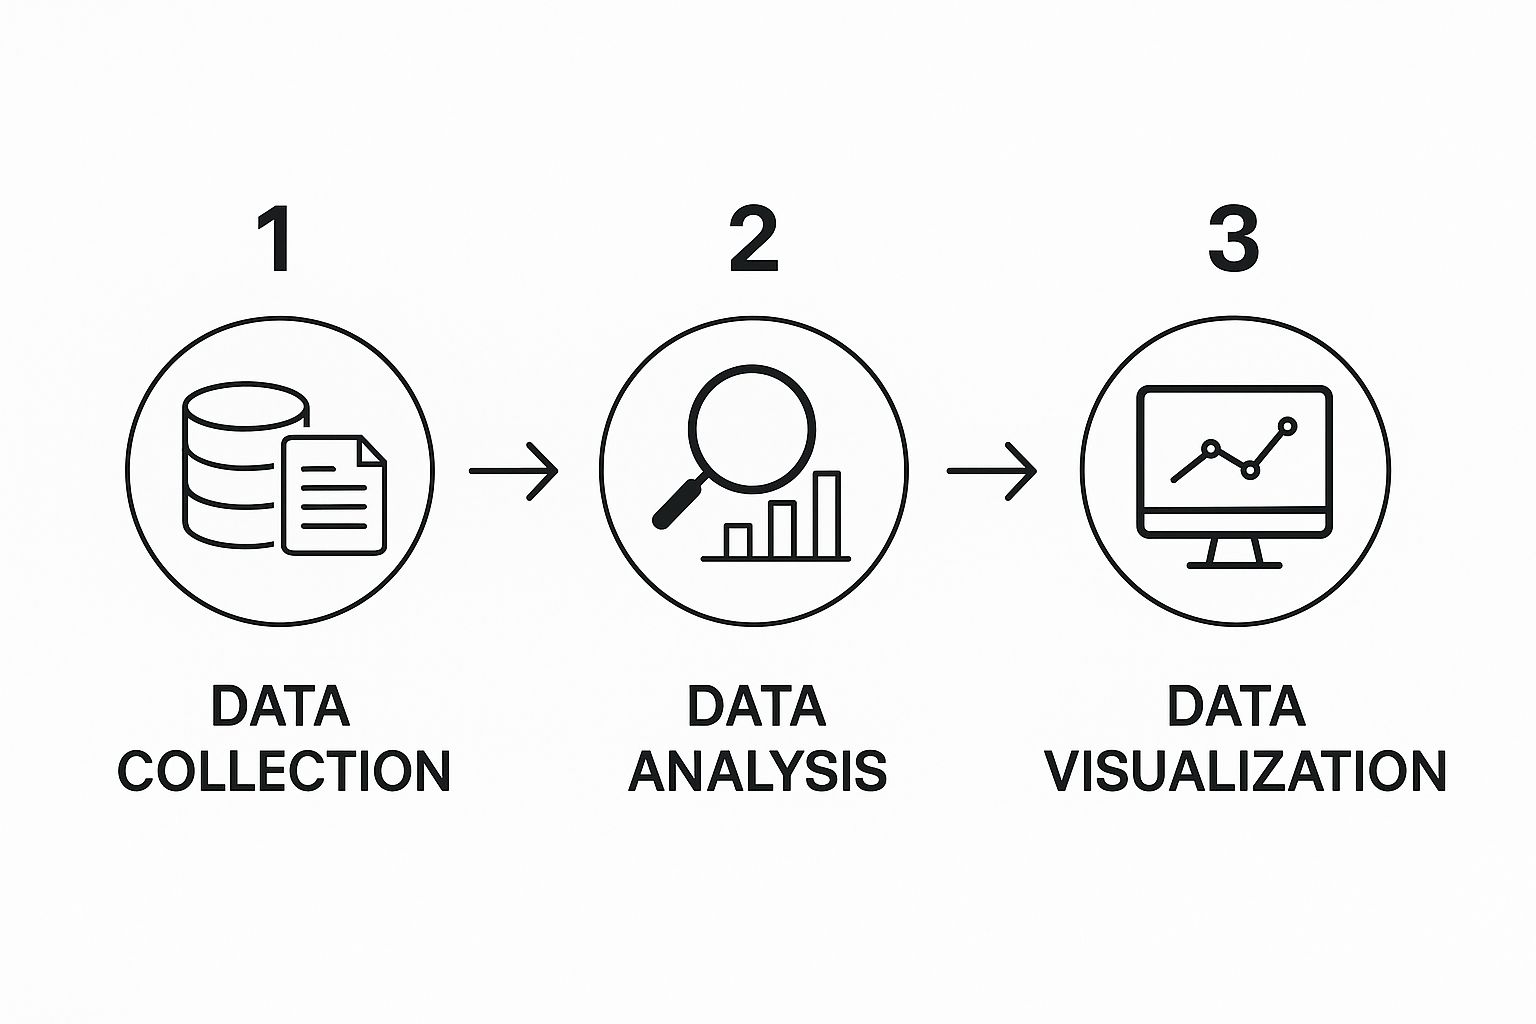
This visual really highlights how a BI dashboard acts as the bridge connecting your raw business data to the strategic decisions you have to make every day.
Stage 1: Data Aggregation and Connection
First things first, a BI dashboard has to connect to all the places your data is stored. This is often the trickiest part, since information is usually scattered across dozens of different platforms and in various formats. The system uses special connectors or APIs to tap into all these data sources, such as:
- CRM software like Salesforce
- Enterprise Resource Planning (ERP) systems
- Cloud databases and accounting software
- Even simple spreadsheets and website analytics tools
By pulling information from all these different silos, the dashboard creates a complete, unified picture instead of just isolated snapshots. This holistic view is the bedrock of any meaningful analysis.
Stage 2: Data Processing and Warehousing
Once the data is pulled in, it’s rarely ready to use. It's often messy and inconsistent, filled with duplicates, errors, and conflicting formats. This is where a process called ETL (Extract, Transform, Load) becomes absolutely essential.
- Extract: The data is pulled from its original source.
- Transform: This is the most important step. The data gets cleaned up, standardized, and structured. For example, the system might convert all date formats to match or get rid of duplicate customer entries.
- Load: The newly cleaned and organized data is loaded into a central hub, usually a data warehouse.
This data warehouse acts as your company's "single source of truth." It makes sure everyone—from the marketing team to the CEO—is working from the exact same reliable information.
By standardizing data through an ETL process, a BI dashboard eliminates the "data chaos" that plagues so many organizations. It turns a mess of conflicting spreadsheets and reports into a trusted, unified asset.
Stage 3: Data Visualization
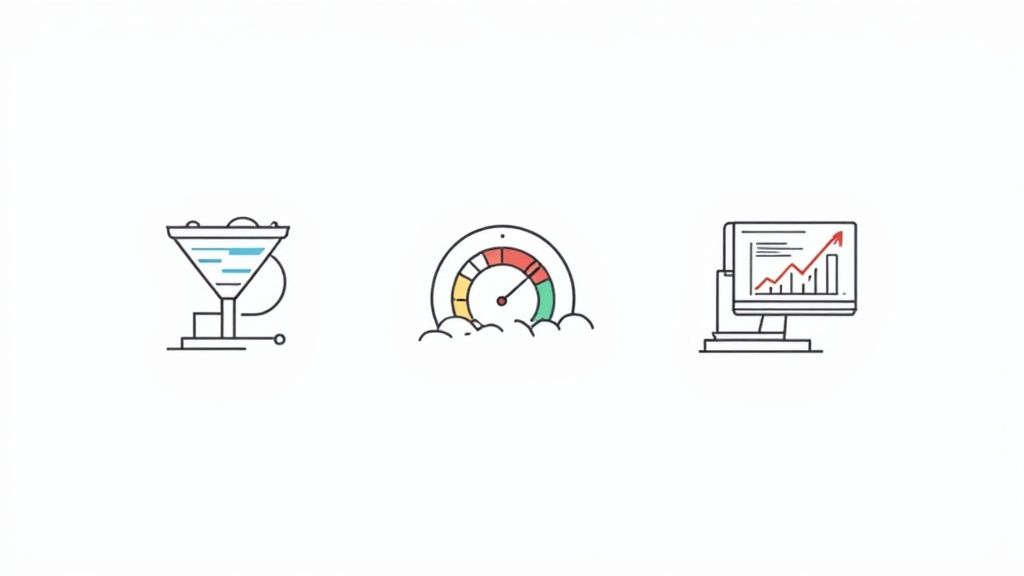
This final stage is where the magic really happens. The BI dashboard’s front-end, the visualization layer, takes all that neatly organized data from the warehouse and brings it to life. Using a whole library of charts, graphs, maps, and tables, it presents complex information in a way the human brain can understand in seconds.
But this isn't just about making data look pretty; it's about making it understandable. A line chart instantly reveals a sales trend, a bar chart compares performance across different teams, and a gauge shows you exactly how close you are to hitting a quarterly goal.
Users can then interact with these visuals—filtering by date, drilling down into specific categories, and exploring the data—to answer their own questions. This turns a complex dataset into a clear path forward.
What Are the Real-World Benefits of Using a BI Dashboard?
Let's move past the technical jargon. What does a BI dashboard actually do for a business? The real magic is how it turns a sea of abstract data into clear, concrete actions that fuel growth and efficiency. It’s the difference between guessing what’s happening in your business and knowing.
This shift from guesswork to certainty is more important than ever. The amount of data we're creating is staggering—it's expected to hit 175 zettabytes by 2025. Companies that can actually use this information are pulling way ahead of the pack. In fact, organizations with high BI adoption are five times more likely to make faster, better-informed decisions.
Speed Up Your Decision-Making
One of the first things you'll notice is how much faster you can make decisions. In the old days, getting answers meant filing a request with the IT department and waiting days—or even weeks—for a report. By the time you got it, the opportunity was often long gone.
A BI dashboard completely short-circuits that delay. It gives leaders and their teams instant access to live data, empowering them to act with confidence right now. No more waiting for a weekly summary; you can see what’s happening as it unfolds.
Imagine a retail manager seeing an unexpected sales dip in the Northeast region from yesterday. Instead of waiting for an end-of-week report, they can open their dashboard, drill down into the specific stores or products that are struggling, and start investigating the cause immediately.
Make Your Operations More Efficient
Beyond big-picture strategy, a business intelligence dashboard is a fantastic tool for fine-tuning your daily operations. It acts like a spotlight, illuminating hidden bottlenecks and performance gaps you’d otherwise never see in the day-to-day chaos. This clarity helps teams pinpoint exactly where things are going wrong.
Think of a logistics company tracking its delivery fleet. A dashboard could show key metrics like:
- On-Time Delivery Rate: Are we keeping our promises to customers?
- Average Time Per Stop: Which drivers or routes are taking too long?
- Fuel Consumption: Are we optimizing routes to keep fuel costs down?
If the dashboard flags a sudden spike in the average time per stop on a certain route, a manager can immediately look into it. Is it traffic? A vehicle issue? They can solve the problem before it becomes a bigger, more expensive headache.
A great BI dashboard turns every team member into a problem-solver. When people can see the numbers they directly influence, it creates a powerful sense of ownership and accountability.
Build a Culture Around Data
Maybe the biggest benefit of all is the cultural shift a BI dashboard can create. When data is visual, accessible, and easy to grasp, it stops being a mysterious thing only analysts understand. It becomes a shared language for the whole company, aligning everyone around the same goals and objective facts.
Teams can track their progress against key performance indicators (KPIs) in real time, making performance management a daily conversation instead of a stressful quarterly review. People start to see exactly how their work connects to the company's bottom line. This kind of visibility is also critical for fair evaluations, which you can learn more about in our guide on how to measure team productivity.
Ultimately, a good BI dashboard puts data into everyone's hands. It breaks down walls between departments and encourages a culture where decisions are backed by evidence, not just gut feelings. It gives every single person the insights they need to do their job better.
Business Intelligence Dashboards in Action
It’s one thing to talk about BI dashboards in theory, but seeing them work in the real world is where it all clicks. These aren't just fancy charts for data analysts. Think of them as custom-built command centers for different departments, helping people make smarter decisions, faster.
Let’s dive into a few examples of how sales, marketing, and finance teams put these dashboards to work every day. Each one is built to answer specific questions and guide the actions that really matter to that team.
The Sales Performance Dashboard
In sales, flying blind is a recipe for disaster. A sales dashboard is the antidote to guesswork, giving leaders a crystal-clear view of their pipeline and helping them forecast revenue with real confidence. It pulls everything together from the CRM and other tools into one clean screen.
Instead of digging through endless spreadsheets, a sales manager gets an instant pulse check on:
- Monthly Revenue vs. Target: A simple visual tells them if they're on pace to hit their number.
- Lead Conversion Rate: This shows how good the team is at turning prospects into actual customers.
- Sales Pipeline Health: A funnel chart quickly reveals how many deals are in each stage, from initial contact to closed-won.
With this view, a manager might notice deals are getting stuck in the negotiation stage. That’s a clear signal to jump in with targeted coaching and help the team get those deals across the finish line.
The Marketing Campaign Dashboard
Marketing teams are constantly juggling campaigns across a dozen different channels. A marketing dashboard is what separates the signal from the noise, pulling data from places like Google Analytics, social media platforms, and email marketing tools.
Suddenly, complex questions get simple answers:
- What's the real Return on Investment (ROI) for our latest campaign?
- Which channels are actually bringing in valuable traffic and leads?
- Is our Customer Acquisition Cost (CAC) going up or down?
Imagine the dashboard shows a specific ad campaign is costing a fortune but converting very few customers. The team can immediately pause that ad and shift the budget to a channel that's performing well. No more wasted spend.
A great dashboard tells a story. For a marketer, it's the story of the customer's journey—from the first click to the final purchase—and it points directly to where the next marketing dollar should go.
The Financial Health Dashboard
For anyone in finance, a real-time view of the company's financial stability isn't just nice to have; it's absolutely essential. A financial dashboard automates the painful, manual reporting process and gives a live snapshot of the business's fiscal health.
It typically visualizes critical metrics like:
- Profit and Loss (P&L): An ongoing look at revenue, costs, and overall profitability.
- Cash Flow: A clear picture of the money coming in and going out.
- Operating Expenses: A breakdown of spending by department, flagging areas to trim the fat.
Armed with this information, finance leaders can do more than just report on the past. They can proactively manage cash, stay ahead of compliance issues, and make strategic calls based on what's happening right now.
This kind of immediate insight is quickly becoming the standard. The global BI dashboard market was valued at around $4.8 billion in 2024 and is expected to jump to $12.4 billion by 2033. That growth says it all: businesses can't afford to operate without real-time data visualization. You can dive deeper into this trend and read the full research on BI dashboard trends.
Comparing BI Dashboards Across Departments
To see just how adaptable these tools are, let's look at how different teams use them side-by-side. This comparison highlights how each business function tracks unique metrics to hit its own strategic goals.
| Dashboard Type | Primary User | Key Metrics Tracked | Strategic Goal |
|---|---|---|---|
| Sales Performance | Sales Manager, VP of Sales | Revenue vs. Target, Pipeline Value, Conversion Rate | Drive revenue growth and accurately forecast sales. |
| Marketing Analytics | Marketing Director, CMO | ROI, Customer Acquisition Cost (CAC), Website Traffic | Optimize marketing spend and generate qualified leads. |
| Financial Health | CFO, Finance Team | Profit & Loss (P&L), Cash Flow, Operating Expenses | Ensure profitability and maintain financial stability. |
| Project Management | Project Manager, Team Lead | Task Completion Rate, Budget vs. Actual, Milestones Met | Deliver projects on time and within budget. |
Each dashboard provides a tailored view, ensuring that every team has the exact information they need to succeed without getting bogged down by irrelevant data.
Of course, these examples are just the beginning. Similar dashboards are indispensable for teams in human resources, operations, and project management. For instance, you can explore a ton of useful layouts in our guide to project management dashboard templates. At the end of the day, a good business intelligence dashboard is whatever a team needs it to be—a versatile tool built to solve their unique challenges.
How AI Is Making Dashboards Smarter
Traditional business intelligence dashboards are great at telling you what’s already happened. Think of them as a rearview mirror for your business. But what if your dashboard could act more like a GPS, showing you the road ahead and suggesting the best route? That’s exactly what’s happening as Artificial Intelligence (AI) and Machine Learning (ML) get baked into modern BI tools.
This shift is moving us beyond descriptive analytics (what happened) and into the far more powerful realms of predictive analytics (what will happen) and prescriptive analytics (what you should do about it). Dashboards are evolving from static report cards into dynamic, strategic partners.
From Manual Analysis to Automated Insights
One of the biggest headaches with old-school BI was the endless manual digging. An analyst could spend hours, or even days, sifting through data to find a single valuable insight. AI flips that on its head.
AI algorithms can churn through massive datasets in seconds, spotting patterns and correlations a person might never find. This is a huge reason why the BI software market is growing so rapidly. This automation doesn't replace your team; it frees them from grunt work so they can focus on strategy and decision-making.
A few game-changing AI features are now becoming common:
- Natural Language Querying (NLQ): This is amazing. You can literally ask your dashboard questions in plain English, just like typing into Google. Instead of writing complex code, you can just ask, “What were our top-selling products in Q3?” and get an answer instantly.
- AI-Driven Anomaly Detection: The system keeps an eye on your key metrics 24/7. If something out of the ordinary happens—like a sudden drop in website traffic or a weird spike in customer complaints—it alerts you immediately. This lets you jump on problems before they snowball.
Predicting the Future with Confidence
This is where things get really exciting. By integrating predictive analytics, dashboards can now use your historical data to forecast what's coming next.
Imagine a retail manager trying to prepare for the holiday rush. Instead of guessing, they can use an AI-powered dashboard to get a data-backed forecast of product demand. This helps them stock the right inventory, plan marketing campaigns, and avoid costly sellouts or overstocks. It’s not a crystal ball, but it’s the next best thing.
An AI-powered dashboard doesn’t just show you a line graph of past sales. It extends that line into the future, showing you a probable trajectory and highlighting the key factors that are driving that trend.
Getting Smarter Recommendations
The final piece of the puzzle is prescriptive analytics. Here, the AI doesn't just predict the future; it tells you what to do to get the best outcome. It’s like having a data scientist built right into your dashboard.
Based on its analysis, the system might suggest concrete actions, such as:
- Reallocating Your Marketing Budget: It might flag that one ad channel is performing poorly and recommend moving those funds to a more profitable one.
- Offering Targeted Discounts: It could identify a group of customers who are at risk of leaving and suggest a specific promotion to win them back.
This turns a BI dashboard from a passive tool for looking at data into an active, intelligent guide. By automating insight discovery and offering smart recommendations, AI is making data useful and actionable for everyone, not just the data experts.
Designing a Dashboard That People Actually Use
You can build the most powerful BI dashboard in the world, packed with incredible data, but it's completely useless if nobody can make sense of it. What separates a tool that drives daily decisions from one that just collects digital dust? It almost always comes down to good design. A great dashboard doesn't just present numbers; it tells a clear story that points people toward the right insights.
The whole process starts with one simple, non-negotiable rule: know your audience. A dashboard for a CEO who needs a high-level view of strategic goals should look nothing like one for a marketing manager tracking the nitty-gritty of daily campaign performance. You have to ask: what questions do they need answered, and what actions will they take based on that information?
Start with a Clear Visual Hierarchy
Think of your dashboard like the front page of a newspaper. The most important headline is always right at the top. Your layout should do the same thing for the user's eye, guiding it naturally to the most critical information first.
This means placing your most important metrics—the Key Performance Indicators (KPIs) that need immediate attention—in the top-left corner. Since most of us read from left to right, top to bottom, this ensures the most vital data is the very first thing they see. Use size, color, and placement to create a visual pecking order.
A well-designed dashboard should pass the "five-second test." Someone should be able to glance at it for just five seconds and immediately grasp the overall health of the business and spot any red flags.
This idea of clarity should apply to everything on the screen. Fight the urge to add clutter. Every single chart, number, and filter needs a clear purpose. If a visual doesn't help someone answer a key question, it's just noise. Get rid of it.
Choose the Right Chart for the Job
Picking the right chart is everything. It’s the difference between clarity and confusion. The wrong visual can actively mislead people, even if your data is perfectly accurate. The goal is always to pick a chart that tells the intended story in the simplest way possible.
Here are a few ground rules:
- Line Charts for Trends: Want to show how a metric changes over time? A line chart is perfect for tracking things like monthly revenue or website traffic.
- Bar Charts for Comparisons: When you need to compare values across different categories—like sales performance by region—nothing beats a simple bar chart.
- Gauge Charts for Goals: To show progress toward a target, like a quarterly sales goal, a gauge or bullet chart gives you that "are we on track?" status at a glance.
- Scatter Plots for Relationships: If you’re trying to see if there’s a connection between two different variables, a scatter plot is the go-to tool.
Getting these choices right is fundamental to clear communication. If you want to dive deeper, our guide on the best practices for data visualization is a great place to start.
Embrace Simplicity and Interactivity
Finally, less is almost always more. Stick to a clean, simple design. Use a limited and consistent color palette—a couple of main colors and maybe some shades for variation is plenty. Loud, clashing colors are distracting and can make a dashboard feel overwhelming. You want the data to be the star, not the design.
Don't forget to add interactive elements like filters and drill-downs. These features empower people to explore the data for themselves, digging into anything that piques their interest. When you give them that control, you transform a static report into a dynamic tool for discovery. And that’s how you build a dashboard that people actually want to use.
Have Questions About BI Dashboards? We've Got Answers
So, we've covered what BI dashboards are, how they work, and why they matter. But even after all that, it's completely normal to have a few practical questions pop up. You get the concept, but now you're wondering about the real-world details.
Let's dig into some of the most common questions people ask. We'll tackle everything from timing and cost to the skills you actually need to get one of these up and running.
When Is the Right Time to Get a BI Dashboard?
A lot of people think BI dashboards are only for giant corporations swimming in data. That’s a myth. The real signal that it's time for a dashboard is when you find yourself making decisions with data you can't easily see or make sense of.
If you're spending your Monday mornings wrestling with spreadsheets or feel like you're making educated guesses instead of data-backed calls, you're ready.
Look for these tell-tale signs:
- Data Silos: Your sales data is in one place, your marketing data is somewhere else, and finance has its own system. Nothing talks to each other.
- Slow Reporting: Getting an answer to a simple question like, "How did last month's sales compare to the month before?" takes days of manual work.
- Lack of Clarity: If you ask five different team members for a key metric, you get five different answers (or blank stares).
If any of that sounds familiar, a dashboard will make an immediate difference, regardless of how big or small your company is.
How Much Does a Business Intelligence Dashboard Cost?
This is the big one, and the honest answer is: it varies. A lot. The cost can range from a very reasonable monthly subscription to a major enterprise investment. What you'll pay really depends on things like how many people will use it, where your data is coming from, and what features you absolutely need.
The good news for small and medium-sized businesses is that most modern platforms offer really flexible pricing tiers. You can start small and grow into it.
But here’s the most important way to think about it: weigh the tool's price against the cost of not having it. What's the cost of a missed opportunity, a hidden inefficiency, or a bad decision made with fuzzy data? The ROI often speaks for itself—some studies have found an average return of 112% for BI projects.
Think of a BI dashboard not as a cost, but as an investment in clarity. The price you pay for the tool is almost always less than the cost of flying blind.
Do I Need a Data Scientist to Use a BI Dashboard?
Absolutely not. This is probably the biggest misconception out there. Yes, you might have someone from IT or a data analyst handle the initial heavy lifting—connecting all the data sources and building out the first few dashboards.
But once it’s set up, these tools are built for regular business users. Modern BI tools are designed for self-service.
With intuitive drag-and-drop interfaces and even features where you can just type a question in plain English, anyone can start exploring. You can poke around, apply filters, and find your own answers. The whole point of a business intelligence dashboard is to get data out of the hands of a select few and make it easy for everyone—from the CEO to a marketing coordinator—to use.
All you really need is curiosity and a willingness to ask, "What is this data trying to tell me?"